2C. Path Operations To Compare Stress at different positions

We have to define path but instead of using locations of points to define
path, we can use a set of nodes.
In this section, you will plot
1.
Von Mises Stress at node 195, 201 and 207
2. Von
Mises Stress at node 2020, 2030 and 2030
Here we
will concentrate on the first plot.
GENERAL
POSTPROC -> Path Operations

Then,
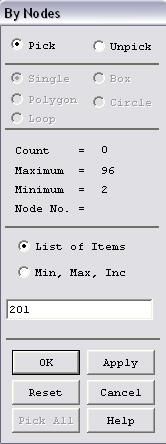
you will see the following window. Type the number of nodes in the order you
want them to appear on the plot. The first node is 195. Then press
Enter using your keyboard. You will notice that the "Count"
variable has been incremented. Then type the second node which is 201. Press
Enter key on your keyboard. Type the last node which is 207. Then click OK.


Then you
will see the following window. Type in the name of the path. In the "Number
of divisions" box, enter 0.
Enter 3 for the box, "Number
of data sets".

What we
have to do next is to specify which values of stresses we want to plot.
GENERAL
POSTPROC -> Path Operations
PATH
OPERATIONS ->
Map onto Path

We have
now selected the Von Mises Stress. Now, we will want to just plot the graph.
GENERAL
POSTPROC -> Path Operations
PATH
OPERATIONS ->
Plot Path Items
PLOT
PATH ITEMS -> On Graph

Highlight
SEQV which represents Von Mises Stress.

You will
then get the following graph. The plot provided by ANSYS is actually misleading.
Along the path you have chosen you would not expect the Von Mises stress to
vary by much. The plot shows a variation of approximately ± 5%, but
that variation appears large due to the auto-scaling of Y-axis values by ANSYS.
Oscillations in stress values for distance values between 0 and 1.5 are not
physical. They are caused by our somewhat coarse mesh.

Below
you will see a plot of the Von Mises stress along the path defined by nodes
2020, 2030 and 2040. The plot yields the expected result that the Von Mises
stress along this path decreases (roughly by a factor of z) as one moves from
the crankshaft (left) end to the pedal (right) end.


